This is Article 02 of 03 in the Beyond the Container series — three articles for engineering leaders navigating the post-Kubernetes era.
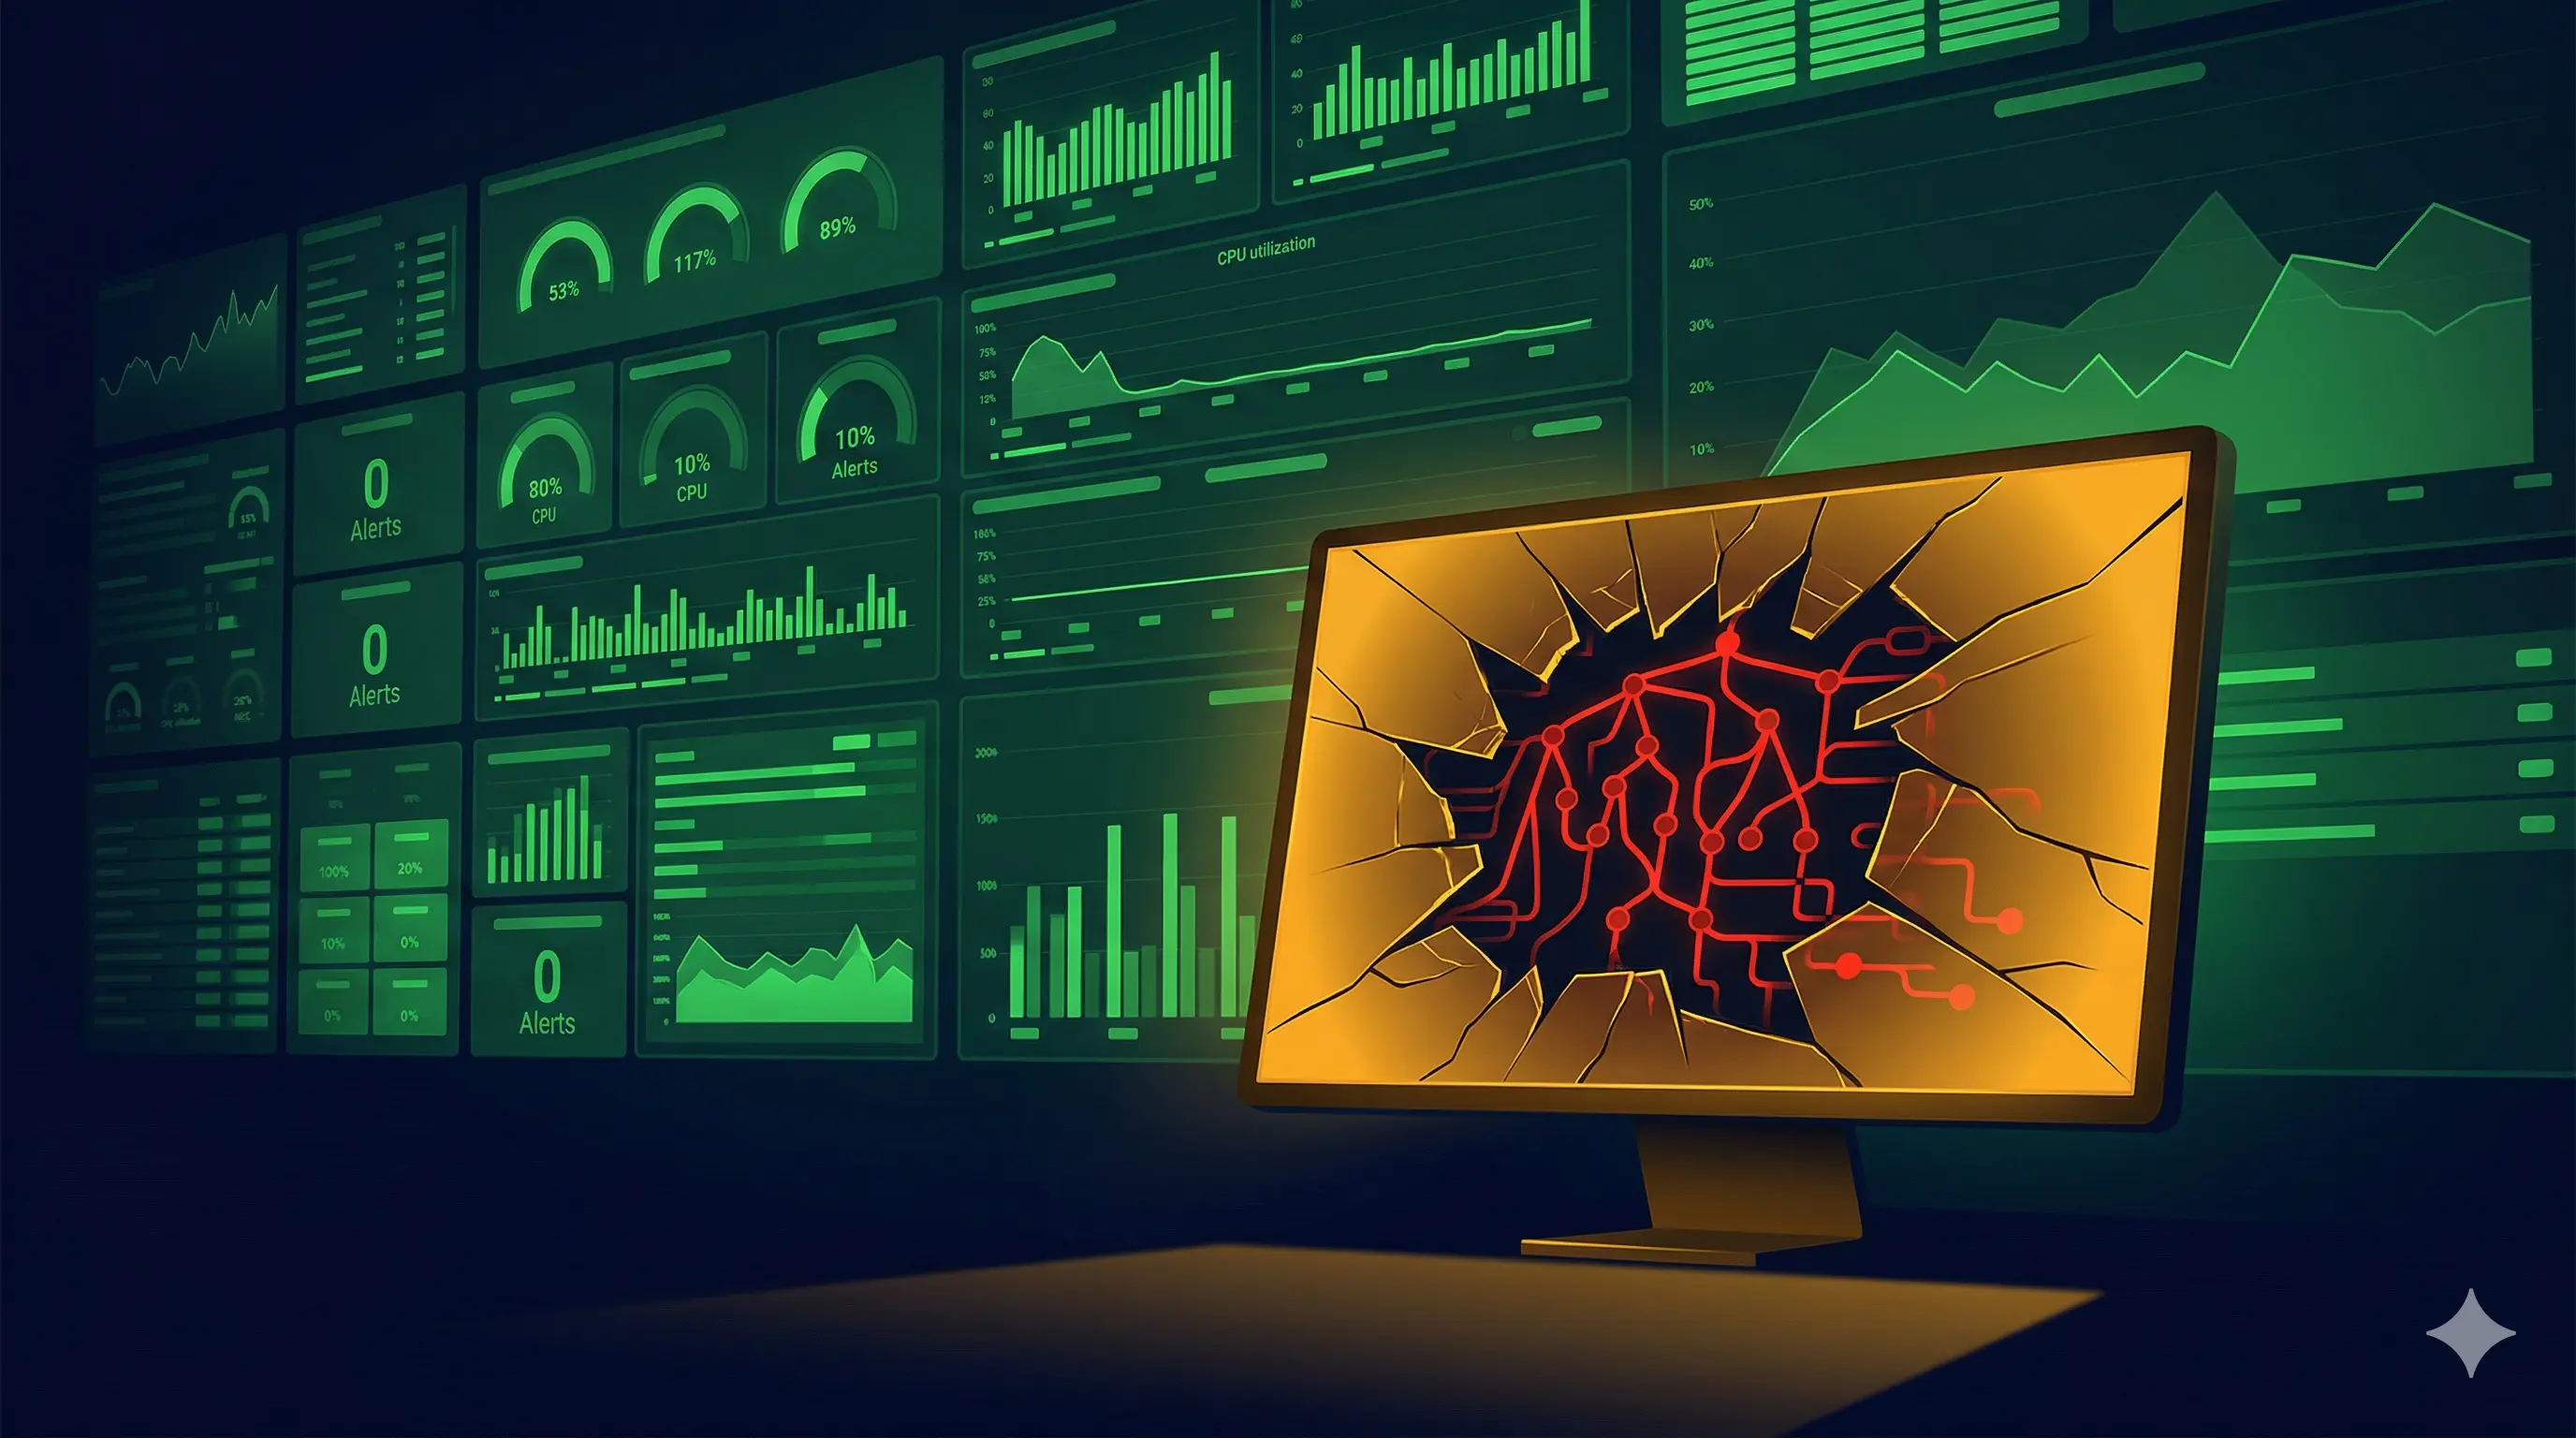
Here is a scenario worth sitting with. Your SRE team is watching 47 Grafana dashboards. CPU is green. Memory is green. Pod restarts: zero. Error rate: 0.02%. Latency P50 is fine. And then your largest enterprise customer calls to report that their checkout flow has been broken for three hours.
No alerts fired. No metrics crossed a threshold. Every signal in your observability stack said the system was healthy. The system was not healthy. The order state machine was in a silent loop that the business logic never recovered from, and your entire monitoring layer had no vocabulary for it.
This is not hypothetical. Variants of this scenario have caused major production incidents at some of the most observability-mature organizations in the world. It exposes the central limitation of infrastructure-level monitoring as a resilience strategy: pod metrics measure what the infrastructure is doing. They cannot measure what the business is experiencing.
"More metrics are not the same as more understanding. The observability crisis in distributed systems is not a data shortage problem. It is a signal quality problem."
Three Paradigm Shifts in Resilience Architecture
Shift 1: From Metrics to Signals
Prometheus metrics measure infrastructure symptoms. OpenTelemetry traces measure the actual causal structure of what happened — across service boundaries, with context. The shift from a dashboard-first to a traces-first observability posture changes not just tooling but how engineers think about their systems.
A traces-first engineer asks: "What was the causal chain that led to this latency spike?" A metrics-first engineer asks: "Which node was hot?" The first question yields actionable understanding. The second leads to more dashboards.
Adding eBPF-based continuous profiling (Parca, Pyroscope) closes the gap between trace and CPU reality by instrumenting the kernel itself, capturing function-level performance data without modifying application code. The combination of OpenTelemetry traces and eBPF profiling creates an observability stack that can answer questions the old model could not even formulate.
| Metrics-First Model | Signals-First Model |
|---|---|
| Aggregate counters and gauges | Causal trace trees with profiles |
| "Which service has high CPU?" | "What caused this user's 5s load?" |
| Dashboard proliferation | Single pane of glass |
| Alert on thresholds | Alert on anomalies |
| Post-incident (reactive) | Pre-incident (predictive) |
Shift 2: Chaos Engineering at the Business Logic Layer
Chaos Monkey killing instances is a useful starting point. But it tests only one class of failure: infrastructure outages. Modern distributed systems fail in far more interesting ways.
The real shift is injecting semantically meaningful failures that infrastructure-layer chaos cannot simulate. A payment provider returning an unusual but valid error code. A downstream API responding with data that passes schema validation but violates an implicit business invariant. A message queue delivering events out of order at statistically plausible rates. These are the failure modes that produce the "silent broken" scenario above.
Tools like Gremlin, LitmusChaos, and the AWS Fault Injection Simulator are good starting points. But the equally important organizational shift is making chaos experiment ownership a feature-team responsibility as part of delivery — not a task delegated exclusively to the SRE platform team. The team that built the state machine is the team that knows how to break it.
This requires psychological safety, governance frameworks that distinguish approved experiments from production incidents, and leadership that treats failure discovery as a competitive advantage rather than a performance issue.
Shift 3: AI-Native Self-Healing Infrastructure
Service meshes (Istio, Linkerd, Cilium) have delivered traffic management and observability for microservices environments. The next generation integrates AI-driven anomaly detection directly into the data plane: detecting latency distribution shifts before they cross SLA thresholds, adjusting circuit breaker thresholds based on observed failure patterns, and triggering pre-emptive traffic shifting before a degrading node impacts users.
AIOps platforms like BigPanda, Moogsoft, and Dynatrace's Davis AI are delivering measurable reductions in alert noise and mean time to resolution. The direction is toward infrastructure that continuously adapts rather than just observes and reports.
Generative AI is beginning to appear in NOC workflows for automated incident summarization, runbook generation, and root-cause hypothesis ranking. And this is where CloudControl's lowtouch.ai platform becomes directly relevant: deploying SRE agents that connect to your observability stack, correlate signals across systems, and take governed autonomous action with full auditability and human-in-the-loop controls where you need them.
"The observability data you generate today is the training corpus for the self-healing systems you will depend on in three years. Instrument well now."
The DORA Metrics Reframe
The DORA metrics — deployment frequency, lead time for changes, change failure rate, mean time to restore — are widely understood as delivery metrics. What is less often recognized is that they are resilience metrics. Change failure rate and MTTR directly measure a system's ability to absorb disruption and recover. That is exactly what chaos engineering aims to improve.
If your DORA metrics were visible to your customers and competitors, what would they reveal about your system's actual resilience posture? For most organizations, that question is more motivating than any dashboard review.
How CloudControl Addresses This
Our ManageZ managed services are built on a Prometheus and Grafana observability stack with centralized log management, alert and incident management, and 24/7 SRE coverage. We operate with a signature SRE approach designed to reduce MTTR and improve system health visibility across multi-cloud and hybrid environments.
We also integrate with lowtouch.ai's SRE Agent, which connects your observability layer to autonomous incident detection, diagnostics, and resolution workflows. The agent does not replace your SRE team. It handles the repetitive, well-understood failure patterns so your team can focus on the novel ones.
Practical challenge for this week: Identify one business-logic failure mode for your most critical user journey that your current monitoring would not catch. Design a chaos experiment that deliberately triggers that failure. Run it in staging. Document what you learn. That exercise will reveal more about your actual resilience posture than six months of retrospective dashboard review.
ManageZ: 24/7 SRE without building the team from scratch. CloudControl's managed SRE service gives you Kubernetes-grade observability, alert management, incident response, and compliance support — without the hiring burden. Learn about ManageZ at ecloudcontrol.com
Next in the series: Infrastructure That Thinks — when AI agents become the ops team, and what that does to your cost model, carbon budget, and competitive position.