
WHAT IS GRAFANA?
Grafana is a multi-platform open-source visualization and monitoring tool that can integrate data from different sources like Prometheus, InfluxDB, Graphite, and ElasticSearch. Available since 2014, this software provides us with visualizations as graphs or charts for a connected data source. It can query or visualize data sources, and it does not matter where they are stored.
WHAT IS PROMETHEUS?
Prometheus is an open-source system that is used for monitoring and as an alerting toolkit. It includes a rich, multidimensional data model, a concise and powerful query language called PromQL, and an efficient embedded time-series database. Prometheus server scrapes and stores time-series data. Most Prometheus components are written in Go language, making it easy to build and deploy as static binaries.
The following are some of the advantages of Grafana with Prometheus as the data source:
- A user can visualize the time series directly in Prometheus Web UI, similar to Grafana.
- Prometheus provides a functional query language called ‘PromQL’ that lets users select and aggregate time-series data in real-time.
- Prometheus can discover targets dynamically and automatically scrap new targets on demand. It offers a variety of service discovery options for scrape targets, including K8s.
OBJECTIVE
In this article, we will cover a step-by-step procedure for setting up Grafana (version 7) with Prometheus (version 2.17) as a data source.
PREREQUISITES
- Ubuntu 18.04 server with a non-root user with sudo privileges.
- Docker (installed and configured).
STEP 1: SET UP CONTAINER FOR GRAFANA-7.0
a) Create a bridged docker network using the following command.
docker network create bridge mybridge
b) Pull the official image from the Docker hub and run the container using the following command:
docker pull grafana/grafana:<version number>
c) Run the container: While running the container, you can use the following command to install the required plugins as well in a single step.
docker run -d –-network mybridgenetwork -p 3000:3000 \
 --name=grafana \
  -e "GF_INSTALL_PLUGINS=grafana-clock-panel,grafana-simple-JSON-data source" \
  grafana/grafana
d) Test the access: Once Grafana is up and running, check whether it is accessible via HTTP://:3000. The default username and password are ‘admin’.
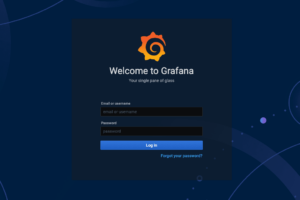
Fig: Grafana Login Screen
STEP 2: SET UP A CONTAINER FOR PROMETHEUS
a) Setup a configuration file: The first step is to create the YAML configuration file as follows:
Prometheus.yaml
b) Setup alerting rules: Create another YAML file to set up the alerting rules in Prometheus (see sample below).
alert.rules.yaml
c) Set up the container: Run the following command to set up the Prometheus container:
Docker run -d –-network mybridgenetwork -p 9090:9090 \
  --name=prometheus \
  -v /path/to/prometheus.yml:/etc/prometheus/prometheus.yml \
  -v /path/to/alert.rules.yaml:/etc/prometheus/alert.rules.yaml \
  prom/prometheus
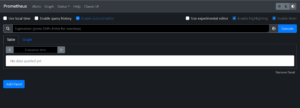
d) Test the access: Once the Prometheus container is up and running, check whether it is accessible via the URL http://:9090.
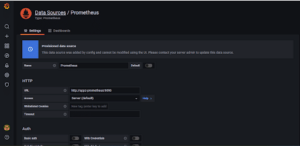
STEP 3: CONFIGURE DATASOURCE FOR GRAFANA
Go to Configuration > Data Sources and select Prometheus from the list.
Set the URL as http://prometheus:9090 and leave everything else untouched.
STEP 4: CONFIGURE THE GRAFANA DASHBOARD
The Grafana dashboard can be configured manually or set up by importing JSON templates.
a) Click on “+” > Import.
b) In the next window, paste the JSON dashboard template and click on “Load”.
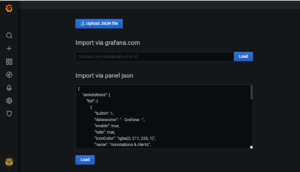
A JSON file for the sample dashboard is given below:
mydashboard.json:
Once this file (mydashboard.json) is loaded by clicking the load button, Grafana will create the dashboard based on this configuration file.
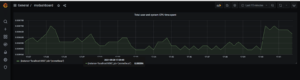
STEP 5: TEST THE DASHBOARD
a)Go to Dashboards > Manage > MyDashboard.
Grafana will start displaying the dashboards/visualizations as shown below.
RESOURCES
- https://prometheus.io/docs/prometheus/latest/installation
- https://grafana.com/oss/prometheus
About The Author

Sreedevi J S
Cloud DevOps Engineer | Cloud Control
Cloud DevOps Engineer with more than three years of experience in supporting, automating, and optimizing deployments to hybrid cloud platforms using DevOps processes, tools, CI/CD, containers and Kubernetes in both Production and Development environments.